Statistics Course in Gurgaon Overview

The Statistics Course in Gurgaon by Gyansetu is a practical training course that includes modules on descriptive statistics, probability, hypothesis tests, regression models, time-series analysis, and statistical quality controls. All of the above concepts are taught using various software like SPSS, R, Python, and Microsoft Excel. It is ideal for those in data analytics, research, business, and academia.

The Statistics Course in Gurgaon by Gyansetu consists of various modules that are designed keeping in mind people who have to apply statistical methods to their real-world projects. These could be data analysts, business analysts, researchers, MBAs, and professionals who do not need theoretical knowledge of statistics but rather its applications. There is no need for you to have any experience in mathematics or statistical software. All you will require is your data.

That is why having skills in statistics is very important in today’s job market in Gurgaon. According to the World Economic Forum, data science and analytics make up one of the fastest-growing professions in the world. Statistics forms the foundation for every career in data analysis. A statistician or data analyst gets an average salary of ₹8 LPA in Gurgaon compared to the national average of ₹6.5 LPA, according to the June 2026 data on Glassdoor. The highest 10% earn more than ₹22.9 LPA. Firms such as KPMG, EY, Deloitte, American Express, Genpact, MakeMyTrip, and PolicyBazaar employ statisticians in Gurgaon’s Cyber City, Udyog Vihar, and DLF Phase areas all year round.

Statistics is no ordinary course of study; it is the language of decision-making from data.

There are modules: descriptive statistics & data summation, probability distributions, sampling techniques & survey designs, hypothesis testing, correlation & regression analysis, time-series analysis & forecasting, statistical quality control, and project on statistical reporting. The tools to be taught are SPSS, R, Python (statsmodels, scipy, pandas), Excel, and Minitab.

Since its inception in 2013, Gyansetu has provided training for more than 32,500 professionals from more than 50 countries, with 20,000+ placements in leading organisations like KPMG, EY, Deloitte, Accenture, and Genpact. The Statistics Course offered by us is certified by NASSCOM, which is a credential highly valued by the research agencies, consulting organisations, and analytics divisions present across the corridors of Gurgaon.

At the end of the course, you will have completed five applied projects, a portfolio of statistical analysis, and NASSCOM-accredited certification. Not a theory examination pass. A body of analytical work that shows employers you can do this — not just describe it.

Why Choose Gyansetu’s Statistics Course in Gurgaon?

There are some statistics components within each data science course in Gurgaon. None of them provide a specialized statistics training – one that focuses on statistics as a comprehensive subject, not a subcomponent of another.

The Statistics Course in Gurgaon by Gyansetu is the only specialized statistics training in Gurgaon that encompasses the practical application of statistical techniques with real datasets, using SPSS, R, and Python in a single training program. This coverage of three languages for statistics and eight statistical techniques in one course is what the job market demands.

5 things that separate Gyansetu’s Statistics Course from the alternatives:

  1. Multi-tool coverage — SPSS, R, Python, and Excel in one programme: Every other statistics training in Gurgaon focuses on only one software tool. None of them teach you how to choose and apply the different software tools for the situation – or that job interviews in Gurgaon will ask you about switching between them. The courses offered by Gyansetu will teach you how to do statistics using all 4 tools.
  2. Real datasets — not textbook examples: Every module in this course is presented with real data. This is a huge difference. Solving a problem from a textbook gives you the process. Solving a real-world problem with incomplete data and with many possible answers gives you judgment, which is what you really need to learn.
  3. NASSCOM-registered certification: There are certificates from all the institutes. The certificate from Gyansetu is accredited by NASSCOM and also confirmed by a live portal on the website gyansetu.in. In analytics positions at KPMG, EY, Genpact, and American Express in the Cyber City of Gurgaon where they hire actively for skilled statisticians, the NASSCOM certificate becomes a benchmark of quality. The certificate is awarded after the capstone module – an end-to-end statistical analysis on a data set – not after taking a test.
  4. Placement support tied to your statistical portfolio: The placement team designs your resume according to five analysis tasks you have done; the regression task, hypothesis testing analysis, and time series analysis among others. When applying for jobs as a data analyst or research analyst, such experience will distinguish you from those who only have studied statistical tools. Gyansetu has been placing graduates in companies like Accenture, KPMG, EY, Genpact, and many more since 2013.
  5. Batch sizes of 5–10 students: Learning statistics is essentially about practicing, and for practice to be effective, there needs to be feedback. With Gyansetu limiting each batch size to 5 to 10 students, you can have direct access to a statistician should your regression model fail to add up, if your p-value conflicts with your null hypothesis, or if you do not know which test to perform.

One question worth sitting with: how much of your current analytical work are you doing correctly — and how would you know if you weren’t?

statistics-course-in-gurgaon

Key Highlights of Statistics Course

100% Placement Support
Free Course Repeat Till You Get Job
Mock Interview Sessions
1:1 Doubt Clearing Sessions
Flexible Schedules
Real-time Industry Projects

Placement Stats

stats
Maximum salary hike
170%
Average salary hike
90%

Our Alumni in Top Companies

Statistics Course Placement Highlights

Avinash Avinash
74 % Hike
NTK
Data Analyst
NTK
Google
Data Analyst
Google
Priya Priya Paswan
57 % Hike
Hear.com
Sales Consultant
Hear.com
vistara
Senior Data Analyst
Vistara

Batches Timing for Statistics Course in Gurgaon

Track Weekdays (Tue-Fri) Weekends (Sat-Sun) Fast Track
Course Duration 2 Months 3 Months 30 Days
Hours Per Day 2-3 Hours 3-4 Hours 6 Hours
Training Mode Classroom/Online Classroom/Online Classroom/Online

Statistics Professional Certification Course in Gurgaon

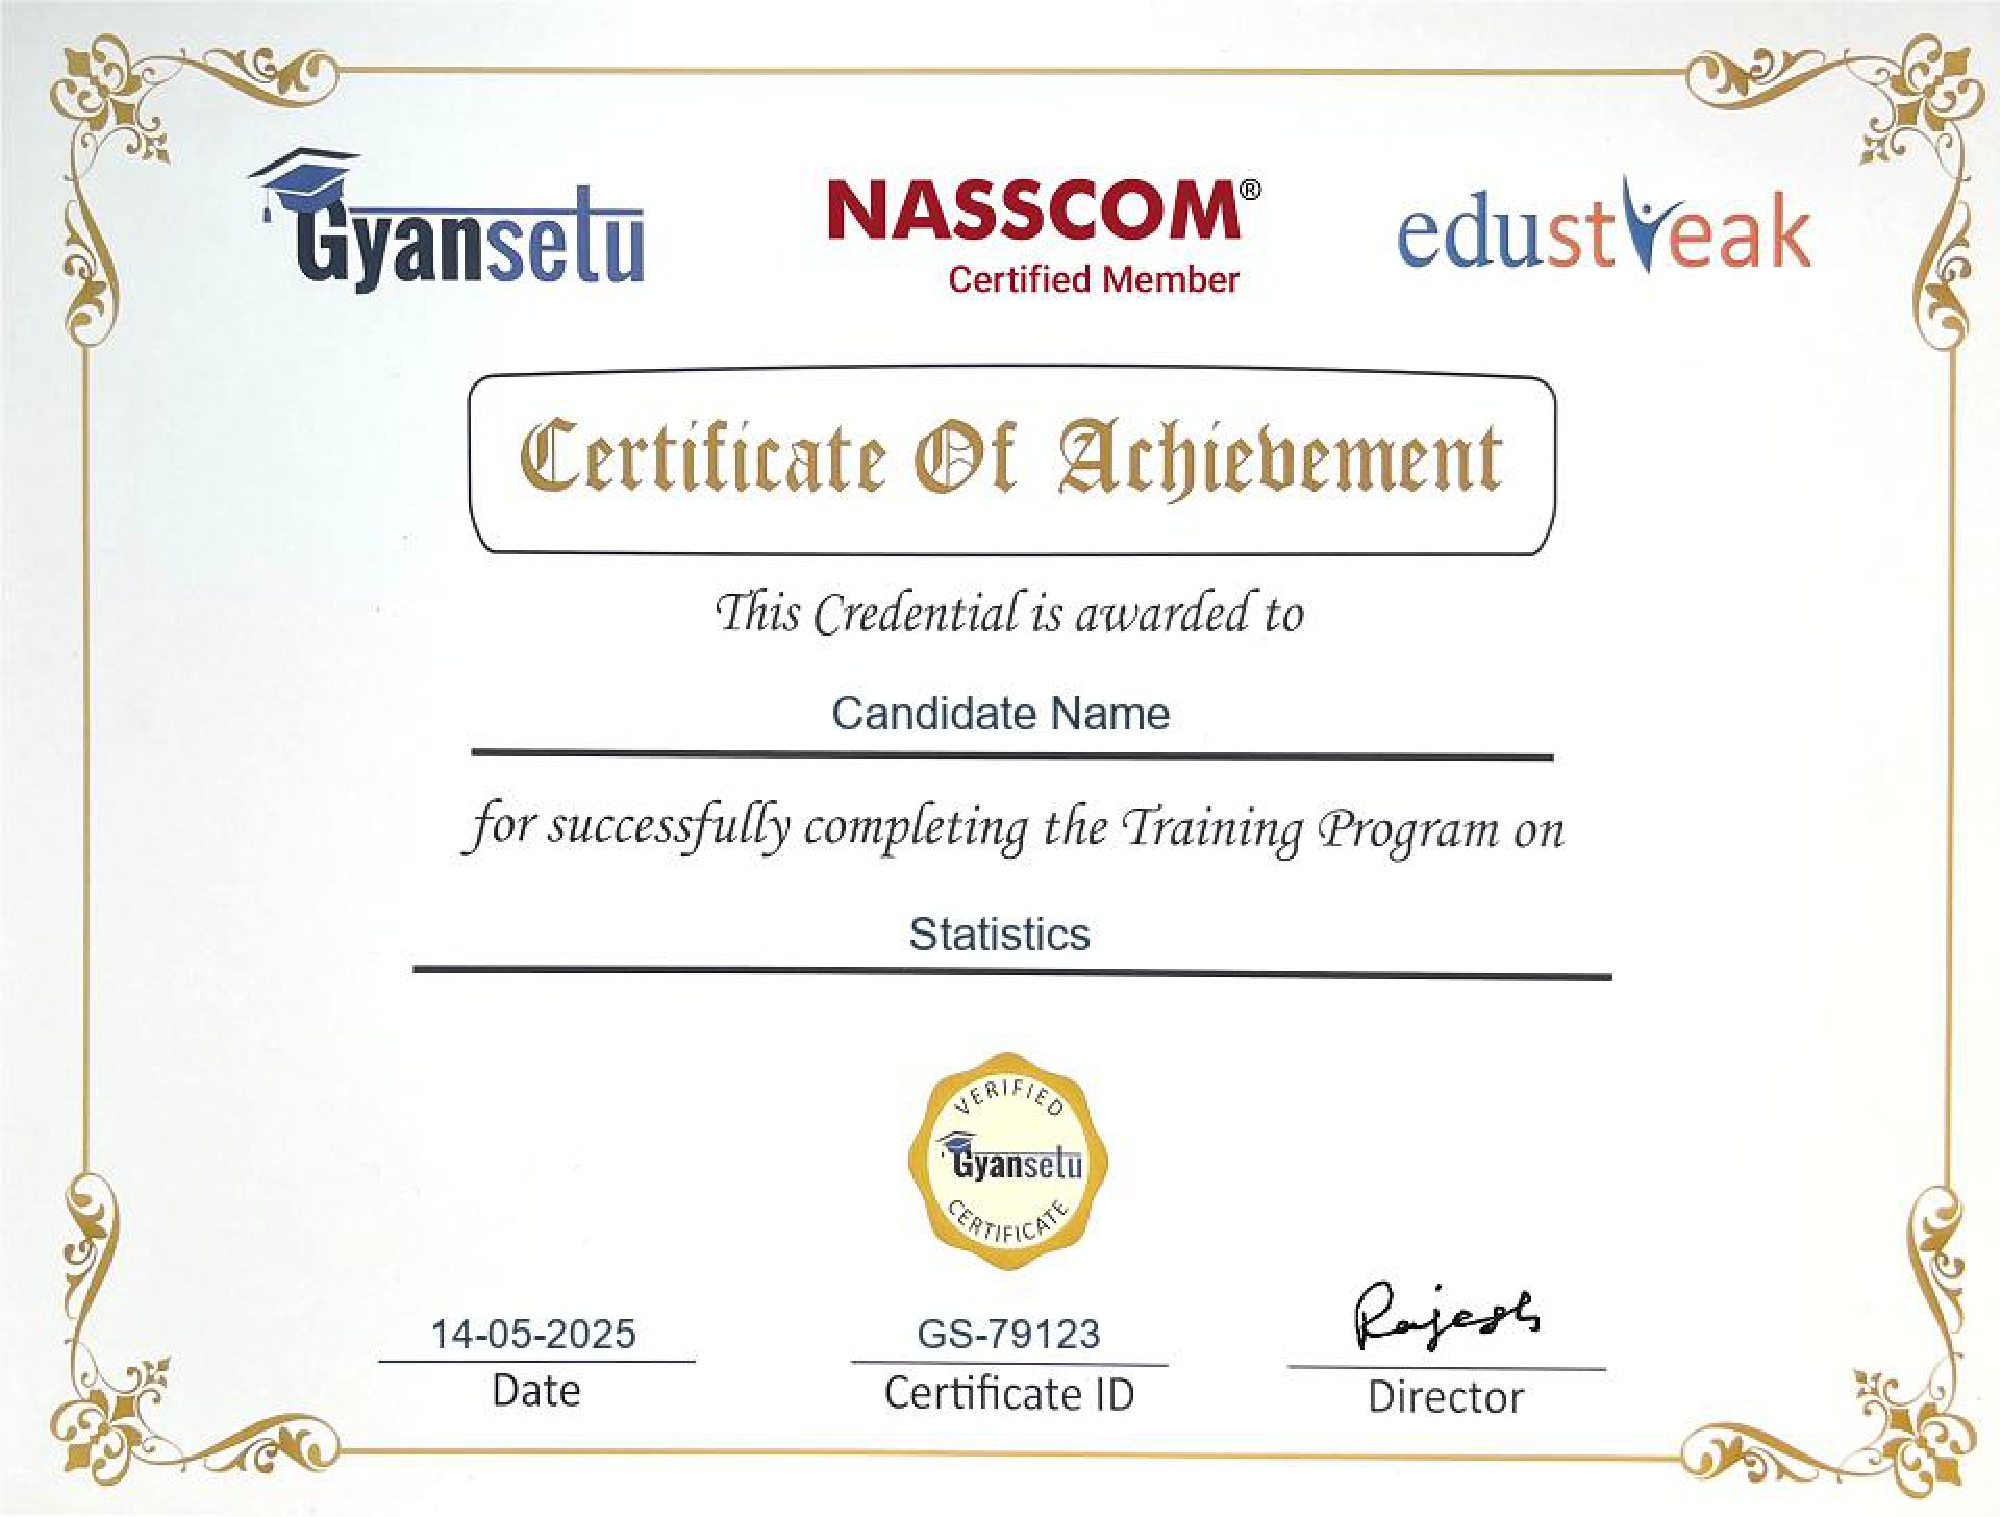
Upon successful completion of your Statistics Course in Gurgaon, you receive a Gyansetu Certificate accredited by NASSCOM, which is the National Association of Software and Service Companies. This certificate is awarded after the successful completion of the   course and is recognized by analytics departments, research organizations, and consultancies in Gurgaon. It comes with a verification code associated with gyansetu.in.

Accreditation from NASSCOM holds value for only one single reason within the analytics industry of Gurgaon. While recruiting for any role, the recruiting manager from organizations such as Deloitte, KPMG, or American Express would consider the reputation of the organization first before considering the content and value of the course. 

There are 3 components of the certificate that will be valuable for employers as well as academic supervisors:

  • Certificate ID number with live validation link at gyansetu.in, which can be validated within 60 seconds.
  • Certificates can be posted on LinkedIn, CV, or research profile which enhances chance of getting selected.
  • Certificate proves that you have completed a statistical analysis exercise based on actual data.

Statistics Course Curriculum

Gyansetu’s Statistics for Data Science Certification will make you equipped with the concepts of Statistics like probability, Descriptive Statistics, Hypothesis testing, Normal distribution, and Sampling. This will help you further understand the machine learning concepts later

Descriptive Statistics 10 Topics
  • Intro to Descriptive vs. Inferential Statistics
  • Types of Data: Nominal, Ordinal, Interval, Ratio
  • Data Cleaning: Missing Values, Outliers, Duplicates
  • Measures of Center: Mean, Median, Mode
  • Measures of Dispersion: Range, Quartiles, IQR, Variance, Standard Deviation, Coefficient of Variation
  • Covariance and Correlation
  • Skewness and Kurtosis
  • Simpson’s Paradox
  • Data Visualisation: Histograms, Box Plots, Frequency Distributions
  • Storytelling with Data
Probability 9 Topics
  • Uses and Need for Probability
  • Basics of Probability
  • Conditional Probability
  • Bayes Rule and Bayesian Inference
  • Binomial Distribution
  • Poisson Distribution
  • Exponential Distribution
  • Central Limit Theorem
  • Introduction to Monte Carlo Simulation
Inferential Statistics 15 Topics
  • Normal Distribution
  • Standard Normal Distribution
  • T-Distribution
  • Point Estimation
  • Confidence Intervals
  • P-Value
  • Hypothesis Testing
  • Levels of Hypothesis Testing
  • Type I and Type II Errors, Statistical Power
  • One-Sample and Two-Sample T-Tests
  • Paired T-Test
  • ANOVA (One-Way and Two-Way)
  • Chi-Square Test: Independence and Goodness of Fit
  • Non-Parametric Tests: Mann-Whitney U, Wilcoxon, Kruskal-Wallis
  • A/B Testing Fundamentals
  • Population vs. Sample
  • Probability Sampling: Simple Random, Stratified, Systematic, Cluster
  • Non-Probability Sampling
  • Sample Size Calculation
  • Questionnaire Design
  • Pilot Testing
  • Sampling Error and Margin of Error
  • Common Sampling Biases
  • Linear Regression Analysis
  • Logistic Regression Analysis
  • Problem of Collinearity
  • WOE and IV
  • Residual Analysis
  • Heteroscedasticity
  • Homoscedasticity
  • R² and Adjusted R²
  • Regularisation: Ridge and Lasso
  • Components of Time Series: Trend, Seasonality, Cyclicity, Noise
  • Moving Averages and Exponential Smoothing
  • Time Series Decomposition
  • Stationarity and ADF Test
  • ARIMA Modelling
  • Forecast Accuracy: MAPE, RMSE, MAE
  • Introduction to Auto-Forecasting Tools
  • Control Charts: X-bar, R-chart, P-chart
  • Process Capability: Cp, Cpk
  • Six Sigma Fundamentals (DMAIC)
  • Acceptance Sampling
  • Root Cause Analysis: Pareto Charts, Fishbone Diagram, 5 Whys
  • Introduction to Multivariate Analysis
  • Principal Component Analysis (PCA)
  • Cluster Analysis: K-Means Segmentation
  • Bootstrapping and Cross-Validation
  • Statistical Ethics: Avoiding P-Hacking and Cherry-Picking
  • Capstone Project: End-to-End Business Case Study

Industry Ready Statistics Projects

You complete 5 applied projects in each of the modules, along with completing a full capstone project in the 8th module. Each project involves working on an actual data set. Each project results in a report. And each project is one that you can show your employer or your professor – it’s not just a textbook problem.
icon
Designed by Industry Experts
icon
Get Real-World Experience
Descriptive Analysis Report
  • What you build: Descriptive statistical analysis report on a data set that includes 10 or more variables – including measures of central tendency, dispersion, distribution, and 5 charts – prepared for a business class rather than for a professor of statistics.
  • Tools used: SPSS, Excel
  • What it proves: That you can take a basic data set, analyze it properly, and explain what that analysis means even to people who have no idea what a standard deviation is. It is the most commonly assigned initial task for new analysts or research assistants at companies such as Genpact and American Express in Gurgaon.
Survey Design and Sampling Framework
  • What you build: Complete survey design for a research project brief, which comprises a probability sampling procedure, sample size determination for 95% confidence level, a questionnaire having 20 questions, report on pilot testing indicating problem areas in three questions, and the refined final version.
  • Tools used: Excel, R, Google Forms
  • What it proves: The fact that you can actually create research that generates reliable data and not just analyze data that was badly generated by another person. Consultants in companies like KPMG and EY spend quite some time designing surveys. And this project proves that you know how to do it.
Hypothesis Testing Analysis
  • What you build: An analysis for hypothesis testing for a research problem faced by a business organization entails choosing and explaining the appropriate test to use based on the research questions, meeting all the assumptions, carrying out the analysis using SPSS, and then interpreting the results in clear English.
  • Tools used: SPSS, R, Excel
  • What it proves: That you can conduct the appropriate test, which isn’t simply any test, and can interpret its implications using language that a decision-maker can take action upon. The mistake of hypothesis testing is one of the most frequently made mistakes in business studies. You have shown that you can avoid making them.
  • What you build: Regression model that predicts a real business measure such as the level of customer satisfaction, sales per month, or employees’ performance using a database containing at least 5 explanatory variables. Assumptions tests, model development, R² value interpretation, and a recommendation report will be included in the project.
  • Tools used: SPSS, Python (statsmodels), R
  • What it proves: This is because you know what causes a particular event to take place, not just the event itself. Regression modelling is one of the most sought-after skills from data analysts when applying for positions with companies such as Deloitte, EY, and MakeMyTrip in Gurgaon.
  • What you build: Statistical analysis from the collection of raw data to final report generation for a genuine project or a project provided by Gyansetu. The final project involves all four stages of analysis covered in the curriculum.
  • Tools used: SPSS, R, Python (statsmodels, scipy, pandas), Excel, Minitab
  • What it proves in an interview: Everything. When a statistician conducts an entire analysis including raw data, cleaned data, hypothesis testing, regression modeling, 12-month prediction, and a layperson’s report, then he/she is at a level which most job applicants for data analyst and researcher positions in Gurgaon cannot come close to. That is what a capstone project is all about.
clock-icon
80+
Hours of content
video
20+
Live sessions
hammer
7+
Tools and software

Statistics Skills you can add in your CV

What Sets This Program Apart?

GyanSetu
Other Courses
Industry Mentors

✔ Working statisticians & analysts
✔ 15+ yrs experience
✔ Active industry professionals

✘ Theoretical trainers
✘ No real exposure

Complete Toolkit

✔ Descriptive to Inferential Statistics
✔ Probability + Regression
✔ SPSS + R + Python
✔ Time-Series & Quality Control

✘ Limited syllabus
✘ Single-tool only
✘ Outdated curriculum

Beginner to Pro Roadmap

✔ Starts from basics
✔ Step-by-step learning
✔ No maths background needed

✘ Assume experience
✘ No structured path

Applied Statistical Learning

✔ Real dataset analysis
✔ Survey design + sampling
✔ Hypothesis testing workflows

✘ No real dataset exposure
✘ Only textbook formulas

Career Specialization

✔ Data Analyst Track
✔ Research Analyst Track
✔ Business Analyst Track
✔ Biostatistician Track

✘ One-size-fits-all
✘ No specialization

Real Industry Projects

✔ 5 applied projects
✔ 1 live capstone analysis
✔ Finance, HR, Healthcare use cases

✘ 1–2 basic projects
✘ Academic examples only

Practical Learning

✔ 70% hands-on
✔ SPSS + R + Python practice
✔ Real business regression models

✘ Theory-heavy
✘ Limited practice

Career Support

✔ Resume building around 5 projects
✔ Interview prep for KPMG/EY/Deloitte
✔ Hiring guidance

✘ No structured support
✘ No networking

course in gurgaon
Who is this course for?
  • Working Data Analysts
  • MBA & PG Students
  • Data-Handling Professionals
  • Healthcare & Market Research Professionals
  • Fresh Graduates in Analytics

Career Assistance for Statistics Course in Gurgaon

briefcase
Job Opportunities Guaranteed

Get a 100% Guaranteed Interview Opportunities Post Completion of the training.

lock
Access to Job Application & Alumni Network

Get chance to connect with Hiring partners from top startups and product-based companies.

Mock Interview Session

Get One-On-One Mock Interview Session with our Experts. They will provide continuous feedback and improvement plan until you get a job in industry.

Live Interactive Sessions

Live interactive sessions with industry experts to gain knowledge on the skills expected by companies. Solve practice sheets on interview questions to help crack interviews.

lock
Career Oriented Sessions

Personalized career focused sessions to guide on current interview trends, personality development, soft skill and HR related questions.

briefcase
Resume & Naukri Profile Building

Get help in creating resume & Naukri Profile from our placement team and learn how to grab attention of HR’s for shortlisting your profile.

Top Companies Hiring for Statistics Role

Honours & Awards Recognition

Denso International
Denso International
Luminous
Luminous
Bharat Petroleum
Bharat Petroleum
Toshiba Midea
Toshiba Midea
BryAir
BryAir
Awarded by GD Goenka University
GD Goenka University
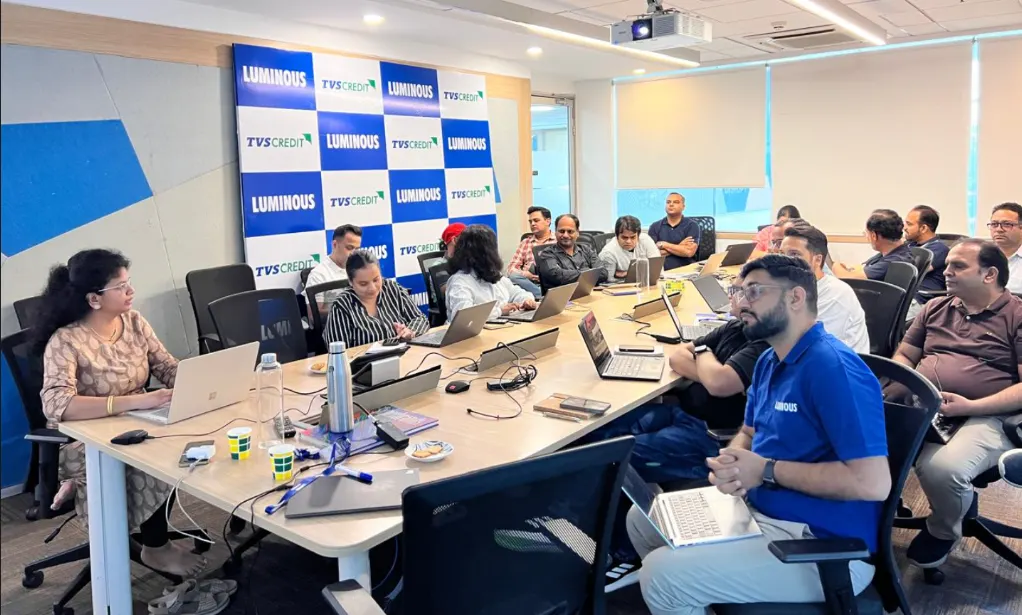
Gyansetu conducted Power BI training for Livpure employees
Livpure
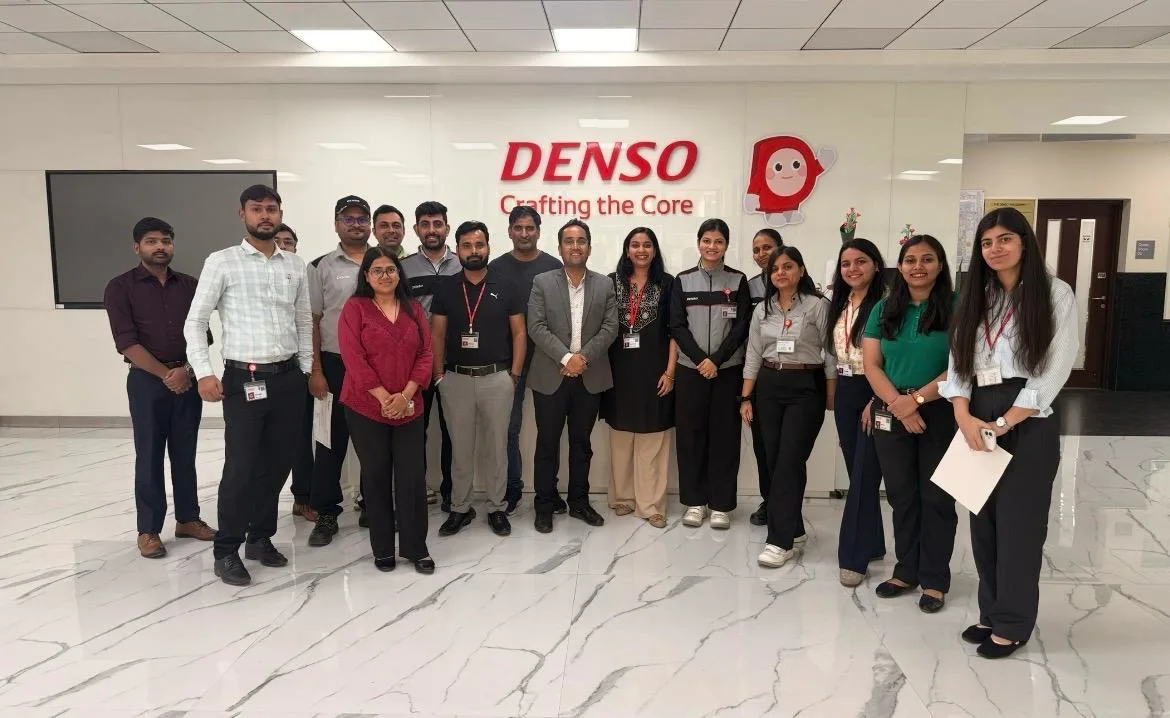
Gyansetu conducted Advanced Excel training for Denso International Employees
Denso International
Gyansetu conducted Full Stack Development training for ReverseLogix employees
ReverseLogix
Gyansetu conducted Advanced Java training for BML Munjal University students
BML Munjal University
Delivering Training To Wedapt
Gyansetu conducted workshop on Cloud Computing and Data Analytics for Manav Rachna University students
Manav Rachna University
Gyansetu conducted Java workshop for GLA University students
GLA University
Gyansetu conducted Data Analytics Workshop for DPGITM students
DPGITM
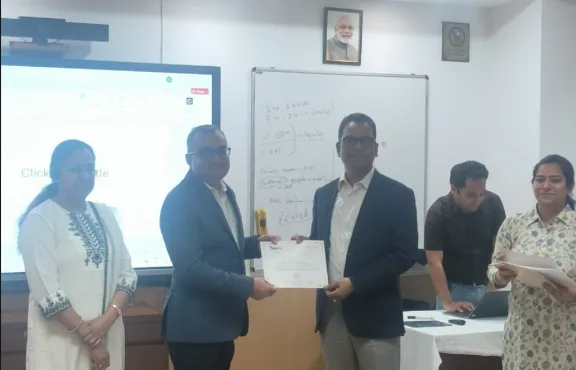
Certificate Issued to Gyansetu by GD Goenka University
GD Goenka University

FOR QUERIES, FEEDBACK OR ASSISTANCE

Contact Gyansetu Learner Support

Our Learners Testimonials

Ankita Mishra
Gyansetu’s commitment to practical learning has been evident throughout my journey as an Associate at EY. The institute’s focus on hands-on projects and real-world applications of Data Analytics principles equipped me with the skills and confidence needed to tackle complex business challenges in my role.
Anupriya Gupta
Transitioning into the role of Data Analyst at Google, I attribute much of my readiness to Gyansetu's practical learning environment. The institute's hands-on projects and real-world case studies provided me with the opportunity to develop the analytical skills necessary to thrive in a dynamic organization like Google.
Karan Bansal
I had a great learning experience with Gyansetu. The trainers were knowledgeable and supportive. The practical approach and hands-on training helped me in my work as an Insurance Operations Associate at Accenture.
self assessment
Self Assessment Test

Learn, Grow & Test your skill with Online Assessment Exam to achieve your Certification Goals.

FAQs: Statistics Course in Gurgaon

Q1: What is the Statistics Course in Gurgaon about?

Statistics course in Gurgaon at Gyansetu comprises a practical approach in learning the course material including descriptive statistics to hypothesis testing, regression analysis, time series forecasting, and statistical quality control through use of software such as SPSS, R, Python, and Excel. This course is for individuals who would like to learn statistics in order to apply in their profession — that is, data analyst, researcher, professional in business or even a student who needs the knowledge of statistics in his/her profession but not to write an exam in university level statistics.

Q2: Who is the Statistics Course in Gurgaon designed for?

It is intended for 5 categories of people – working data analysts who require a sound understanding of statistics, MBA/PG students who use statistics in their projects, working professionals dealing with data and interpreting the results statistically, healthcare/social science/market research professionals, and fresh graduates looking for opportunities in analytics in Gurgaon. It is suited to people who are confident about performing basic calculations, and preferably have handled data using Excel. No prior experience in statistics is required – the first module begins at the very basics of statistics.

Q3: What is the salary after completing a Statistics Course in Gurgaon?

Average salary for Data Analysts in Gurgaon, which is the principal job profile for statisticians in India, stands at ₹8 LPA, 23% more than the countrywide average, as per Glassdoor stats from June 2026. The typical pay scale is between ₹5.5 – 12 LPA, with those in the top 10% earning more than ₹22.9 LPA. Entry-level salaries for statisticians in India are anywhere between ₹3.6 – 6.2 LPA (as of July 2025, Coursera/Glassdoor). Statisticians who possess proficiency in both Python and machine learning earn a hefty premium — positions offered by KPMG, EY, Deloitte, and Genpact in Gurgaon’s Cyber City pay an average of ₹10-20 LPA.

Mathematics at an advanced level is not needed. This is a course intended for people who use data and didn’t take courses in statistics. Each idea is first presented with a practical example and only then with mathematical formulae. When math cannot be helped, such as in the estimation of regression coefficients, the calculation of probability, or the statistics of a test, you will see how it’s done step by step in Excel and SPSS.

This course involves the use of all 3 – SPSS, R, and Python – as well as Excel and Minitab. SPSS is the most popular software for statistics in business research and health care analytics. R is the industry standard for statistical computation in research and academia. Python (statsmodels, scipy, pandas) is increasingly in demand by tech firms and consultants in hiring data analysts. There is no need to select any particular tool.

The graduates are eligible for six different positions which are: Data Analyst, Research Analyst, Business Analyst, Market Research Analyst, Biostatistician, and Statistical Quality Control Analyst. The firms that have opened up hiring opportunities for positions requiring statistical skills in Gurgaon include KPMG, EY, Deloitte, McKinsey, BCG, American Express, Genpact, MakeMyTrip, and PolicyBazaar. The Gyansetu placement team helps to shape your resume based on your five projects on analysis.

Statistics refers to the mathematical science that deals with techniques for collecting, analyzing, and interpreting data. Data Science, on the other hand, is a wider field that integrates statistics with software coding, machine learning, and data engineering. A data scientist will use statistics but not necessarily machine learning techniques. For many of the business or research positions in Gurgaon, a solid background in statistics along with SPSS, R, and Python skills becomes more relevant than a general data science background with weak statistics knowledge.

Absolutely — statistics will be even more pertinent in 2026 than before. With increasing amounts of data, chances of erroneous conclusions become higher. While machine learning solutions and dashboard systems allow for faster analysis, they fail to tell if the analysis is correct. Statistics are what makes one understand if the conclusion is true or just a coincidence, if the forecast is based on reality or random data, and if a managerial decision has a basis in facts or just an excuse. The WEF’s forecast for the job market of 2026 includes data analysis and statistics in its list of the most relevant skills.

A hypothesis test is the statistical method of determining whether there is an actual difference or correlation that exists between groups or variables based on sample data. This is important since most decisions made in business today require comparisons of different things; for example, which campaign works better, whether the new procedure improves quality, whether customer satisfaction is greater in one area compared to others. Without hypothesis testing, the answers would only be opinions. With hypothesis testing, the answers can be backed up with proof. 

Descriptive Statistics covers the summarisation and description of the data set, such as mean, variance, distributions, and graphical representation. Inferential Statistics involves drawing an inference about a population using a sample through hypothesis testing, confidence intervals, and regression models. Both of them are taught in this course. Most analyses usually use both types of statistics; descriptive for knowing the data, and inferential for answering the research question.

The Statistics Course at Gurgaon spans modules and includes both live classes and practical projects. Batches are available on weekends as well as weekdays, depending on your preference. All lectures will be recorded, allowing you to watch them anytime during the course period – hence even during exam time or project deadlines you will not miss out. It usually takes 2 to 3 weeks to do a project in Module 8.

You will get a Gyansetu certificate which is registered through NASSCOM – The National Association of Software and Service Companies, accepted by researchers, consulting firms, and analysts in Gurgaon’s Cyber City and Udyog Vihar Corridor. The certificate is based on completion of your work for the Module 8 capstone project, and not simply your presence at class. This is because the certificate has a unique ID number, valid for use on the gyansetu.in site, and verifiable by any company within less than a minute.

frequently asked questions by students for courses
Drop us a Query
+91-9999201478

Available 24x7 for your queries

Please enable JavaScript in your browser to complete this form.
Categories