


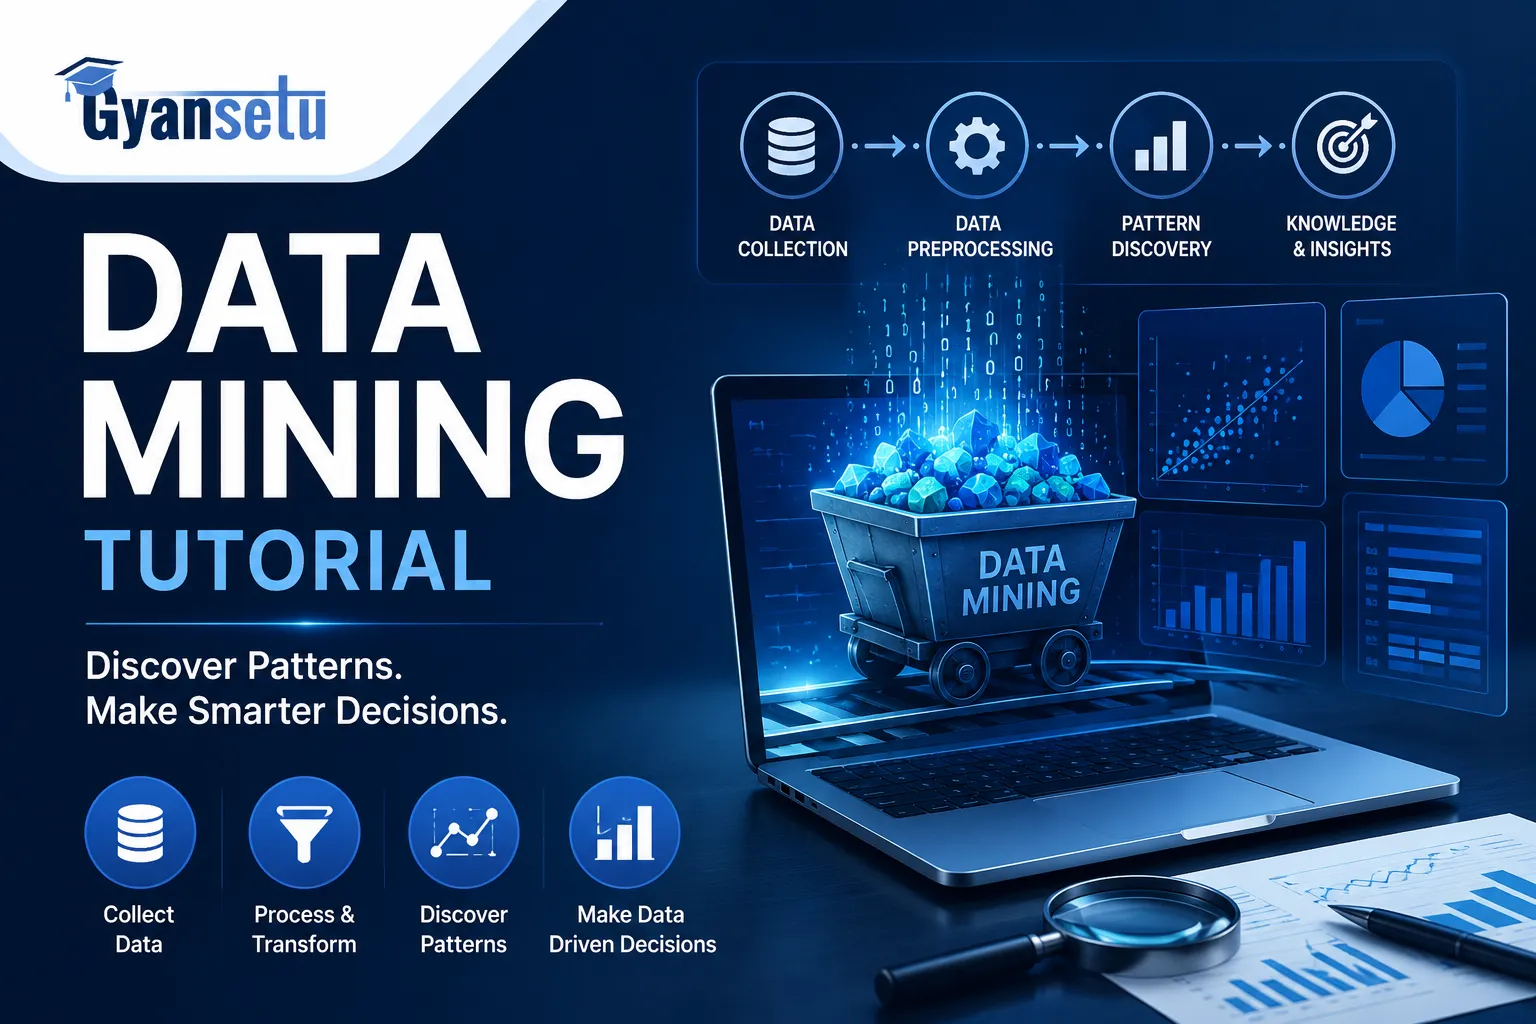
The majority of people usually learn about data mining by committing different algorithms to memory. This is not the right way to go about it. The actual thing that makes data mining an important skill is understanding what questions you want answered and selecting the appropriate approach for doing so. Data mining involves analyzing large data sets to discover trends, outliers, and relationships between different factors using statistical methods and computing techniques. Data mining results in actionable insights like fraud alerts, customer recommendations, or even patient risks.
This tutorial will guide you through the whole process in the correct sequence, just like it would be done in any real-world scenario, beginning with processing the raw data and ending with assessing the effectiveness of the created model. Each step comes with its own article for further in-depth study.
- Covers the full pipeline: ETL → EDA → techniques → model evaluation
- Includes a technique-selection table so you know which method fits your problem
- Python code examples for every major algorithm
- Common mistakes section — what goes wrong in real projects, not toy datasets
What Will I Learn?
Introduction to Data Mining
AI, machine learning, and data mining are different things even though most explanations treat them as such. Here is how they differ in practice: AI refers to the general idea of creating intelligent machines. Machine learning is a way of doing it. Data mining is an approach to discovering patterns in the existing data that employs machine learning among other things. One does not need machine learning to conduct data mining since statistical association rules and clustering can be done without it. However, no matter what kind of analysis one uses, data preparation and exploration are inevitable steps.
- Introduction to Data — Types, Sources and Formats
- What is Data Mining? — Complete Beginner’s Guide
- Data Mining vs Machine Learning vs AI — The Real Differences
- Descriptive vs Predictive vs Prescriptive Modelling
- Challenges of Data Mining — Scalability, Privacy and Noise
- Applications of Data Mining — Industry-by-Industry Breakdown

Data Science Course
Program Highlights
✓ 6 Months Industry-Focused Program
✓ Live Classes by Industry Experts
✓ 15+ Real-World Projects
✓ Resume & Interview Preparation
✓ Placement Assistance
Skills You’ll Build
Python • SQL • Power BI • Statistics • Machine Learning • Generative AI
Which Data Mining Technique Should You Use?
Don’t start with an algorithm; start with your business problem. The following table describes the relationship between the most frequently asked questions and the corresponding algorithm. Use this table before you even consider opening your notebook. However, in reality, many business problems require a combination of multiple rows from this table, such as anomaly detection combined with classification, for example.
| Business Question | Data Has Labels? | Technique | Everyday Example |
| Which category does this record belong to? | Yes | Classification | Spam detection, loan approval, disease diagnosis |
| What number will this produce? | Yes | Regression | House price prediction, sales forecasting |
| What natural groups exist in this data? | No | Clustering | Customer segmentation, document grouping |
| What items appear together frequently? | Transactional | Association Rule Mining | “Frequently bought together”, playlist generation |
| Which records are unusual or suspicious? | No | Anomaly Detection | Credit card fraud, network intrusion |
| What will happen next based on the past? | Yes | Time Series / Predictive Analytics | Stock trend, energy demand, churn prediction |
- How to Choose the Right Data Mining Technique — Decision Guide
- Supervised vs Unsupervised Learning — What the Difference Actually Means
- Comparing Classification and Prediction Methods
Data Mining Process
The industry-standard process model is called CRISP-DM (Cross Industry Standard Process for Data Mining). This process model was developed in the late 1990s by a consortium consisting of SPSS, NCR and Daimler-Benz. Six stages: business understanding → data understanding → data preparation→modelling → evaluation → deployment. The stages do not always follow in a strictly linear fashion – one will oscillate between data preparation and modelling until the model is ready to be evaluated.
The academic precursor to this model is called KDD (Knowledge Discovery in Databases). This process model describes the same thing but uses slightly different terminology and focuses more on the knowledge discovery part of the process. Being familiar with both is important as research papers tend to use the terminology of KDD.
- Data Mining Process — End-to-End Overview
- CRISP-DM Model — Six Phases Explained with Examples
- KDD Process — Academic Framework for Knowledge Discovery
- Setting Business Objectives Before You Touch the Data
- Data Interpretation and Communicating Results to Stakeholders
Extract, Transform, Load (ETL)
In reality, however, the most critical point where data mining fails is at the ETL phase, not during algorithm development or parameter tuning. Data comes dirty – missing values, duplicates, inconsistent dates, merged columns to be separated. Cleaning takes more time than everything else put together. According to reports, Walmart was one of the first retail companies to mine transactions on a large scale in the 1990s, yet they took months to prepare their data before any analysis could take place.
The hard truth about data quality
Garbage in. Garbage out. A model trained on dirty data will produce confident, wrong answers. No algorithm compensates for bad inputs. Data preparation is not a preliminary step you rush through — it is the work.
Extract — Data Collection
The data sources can include relational databases, APIs, flat files, web scraping, sensors, and log files. Before you even begin collecting the data, make sure that the data source has the data signals you need. One frequent error is spending several weeks setting up the pipeline only to discover that the data source is inadequate for your purposes.
- Data Collection — Methods and Best Sources by Data Type
- Structured vs Unstructured vs Semi-Structured Data
- Data Quality — How to Assess It Before You Start
- Aggregation in Data Mining
- What is a Data Lake? — vs Data Warehouse
- Web Scraping for Data Collection — Legal and Technical Guide
Transform — Preprocessing and Cleaning
This is the longest stage in most projects. Missing data must be handled, through imputation, deletion, or tagging, and each approach will have an effect on your outcomes. Categorical data must be encoded. Numerical data may require scaling, so as not to weigh heavily a column in millions compared to another in single units. Outliers should be determined to be either noise or actual data.
- Data Preprocessing in Data Mining — Full Walkthrough
- Handling Missing Values — Imputation Strategies Compared
- Data Cleaning vs Data Processing — What Each Actually Covers
- Data Integration — Merging Multiple Sources Without Errors
- Normalization and Standardization — When to Use Each
- Encoding Categorical Variables — Label, One-Hot and Target Encoding
- Feature Selection — Removing What Does Not Help the Model
- Feature Extraction — Dimensionality Reduction Techniques
- Data Reduction — Making Large Datasets Manageable
Load — Data Warehousing
A data warehouse holds cleaned and organized data that is ready to be analyzed. The data warehouse is designed for heavy reading queries, unlike your application, which uses write-heavy databases. There are two main types of architecture: star schema and snowflake schema. Star schema is more straightforward and faster than snowflake schema.
- What is a Data Warehouse? — Architecture and Components
- Star Schema vs Snowflake Schema — Which to Use
- Metadata in Data Warehousing — What It Is and Why It Matters
- ETL Process in Data Warehouse — Step-by-Step Guide
- ELT vs ETL — The Modern Cloud Difference
Exploratory Data Analysis (EDA)
Once upon a time, a team created a model predicting churn that achieved an impressive 94% accuracy on their test set. All hands cheered. Then someone decided to analyze the class distribution — 93% of all observations belonged to “not churned”. The model was clever enough to recognize that everything was “not churned” and remained 94% accurate. The truth is, this disaster could have been avoided by spending just three minutes on EDA before even thinking about modeling.
EDA refers to analyzing the data before modeling it, including understanding the data distributions, the relationships between variables, the class balance, missing values, outliers, and correlations. However, remember that correlation does not equal causation, and this fact cannot be overstated. Tyler Vigen showed that the price of Amazon stocks correlated very strongly with the number of children named “Stevie” from 2002 to 2022. There is a clear correlation between those data points. However, the relationship is meaningless.
- Statistics for Data Mining — Mean, Median, Variance and Beyond
- Data Distribution — How to Read and Interpret Histograms
- Correlation Analysis — Pearson, Spearman and Kendall Compared
- Outlier Detection — Statistical and Visual Methods
- Class Imbalance — How to Detect It and What to Do
- Types of Graphs in Statistics — Choosing the Right Visualization
- EDA in Python with pandas and Seaborn — Practical Guide
Data Mining Techniques
Each technique below is described with what it does, when to use it, a real example and a minimal Python implementation. The code examples use scikit-learn — the standard Python library for data mining and ML as of 2026.
Classification Supervised
Classification answers one question: given what you know about a record, which category does it belong to? The algorithm is trained on labelled data — thousands of examples where the correct answer is already known — and it learns the boundary between categories. The decision tree is the most interpretable classifier; you can follow its logic step by step. Random Forest and Gradient Boosting are more accurate but harder to explain. For a first attempt, always start with the interpretable option.
from sklearn.tree import DecisionTreeClassifier
from sklearn.datasets import load_iris
from sklearn.model_selection import train_test_split
from sklearn.metrics import accuracy_score

X, y = load_iris(return_X_y=True)
X_train, X_test, y_train, y_test = train_test_split(
    X, y, test_size=0.2, random_state=42
)
clf = DecisionTreeClassifier(max_depth=3, random_state=42)
clf.fit(X_train, y_train)
print(f"Accuracy: {accuracy_score(y_test, clf.predict(X_test)):.2f}")
# Output: Accuracy: 0.97- What is Classification in Data Mining?
- Decision Tree Classifier — Concept and Python Implementation
- Naïve Bayes Classification — When It Works Surprisingly Well
- K-Nearest Neighbor (KNN) — Distance-Based Classification
- Support Vector Machine (SVM) — Maximum Margin Classification
- Random Forest — Ensemble Classification Guide
- Rule-Based Classification — If-Then Logic for Structured Data
Regression Analysis Supervised
Regression predicts a continuous number rather than a category. Use it when your output is a quantity — revenue, temperature, time to failure, customer lifetime value. Linear regression is the baseline: fast, interpretable and often good enough. When the relationship between features and outcome is non-linear, regularized variants (Ridge, Lasso) or tree-based regressors work better. The choice between regression and classification is decided entirely by your output variable — continuous means regression, discrete category means classification. Not by personal preference.
from sklearn.linear_model import LinearRegression
from sklearn.datasets import fetch_california_housing
from sklearn.model_selection import train_test_split
from sklearn.metrics import mean_squared_error
import numpy as np

X, y = fetch_california_housing(return_X_y=True)
X_train, X_test, y_train, y_test = train_test_split(X, y, test_size=0.2, random_state=42)
reg = LinearRegression()
reg.fit(X_train, y_train)
rmse = np.sqrt(mean_squared_error(y_test, reg.predict(X_test)))
print(f"RMSE: {rmse:.2f}") # Output: RMSE: 0.73- Linear Regression — Formula, Assumptions and When to Use It
- Multiple Linear Regression with Python
- Ridge and Lasso Regression — Regularization Explained
- Support Vector Regression (SVR) — Non-Linear Regression
- Regression vs Classification — How to Choose
Clustering Unsupervised
Clustering finds natural groups in data without any labels — you hand the algorithm a dataset and ask “what structure exists here?” K-Means is the standard starting point. It assigns every record to one of K clusters by minimizing the distance between records and their cluster center. The number K has to be specified upfront; the elbow method helps you pick it by plotting inertia against different values of K and finding where the curve bends. DBSCAN is the better choice when clusters are irregular shapes or when you expect noise points that belong to no cluster.
from sklearn.cluster import KMeans
from sklearn.datasets import make_blobs
import matplotlib
matplotlib.use('Agg')
import matplotlib.pyplot as plt

X, _ = make_blobs(n_samples=300, centers=4, random_state=42)
km = KMeans(n_clusters=4, random_state=42, n_init=10)
labels = km.fit_predict(X)

# Elbow method -- find optimal K
inertias = [KMeans(n_clusters=k, random_state=42, n_init=10).fit(X).inertia_
            for k in range(1, 9)]
print("Inertias:", [round(v, 1) for v in inertias])
# Drop sharply, then levels off -- the elbow is your K- K-Means Clustering — Step-by-Step with Python
- The Elbow Method — Choosing the Right Number of Clusters
- Hierarchical Clustering — Agglomerative vs Divisive
- DBSCAN — Density-Based Clustering for Irregular Shapes
- Cluster Analysis — Interpreting and Validating Your Results
- Associative Classification — Combining Clustering and Rules
Association Rule Mining Transactional
The Apriori algorithm was published by Rakesh Agrawal and Ramakrishnan Srikant in 1994 . It remains the algorithm taught in almost every data mining course today — which tells you something about how durable the core idea is. The premise: if customers who buy X frequently also buy Y, that relationship can be measured. Support measures how often X and Y appear together. Confidence measures how likely Y is given X. Lift tells you whether the association is stronger than random chance. Amazon’s “frequently bought together” and Spotify’s playlist generation both run on versions of this principle.
# Using mlxtend for association rule mining
# pip install mlxtend
from mlxtend.frequent_patterns import apriori, association_rules
import pandas as pd

# Sample transaction data (one-hot encoded)
data = {'bread':[1,1,0,1,1], 'butter':[1,0,0,1,1],
        'milk':[0,1,1,1,0], 'eggs':[1,0,1,0,1]}
df = pd.DataFrame(data)

freq = apriori(df, min_support=0.5, use_colnames=True)
rules = association_rules(freq, metric="confidence", min_threshold=0.7)
print(rules[['antecedents','consequents','support','confidence','lift']])- Association Rules — Support, Confidence and Lift Explained
- Apriori Algorithm — How It Works and Python Implementation
- FP-Growth Algorithm — Faster Alternative to Apriori
- Market Basket Analysis — Retail Use Case with Real Data
- Frequent Pattern Mining — Types and Techniques
Anomaly Detection Unsupervised
Anomaly detection finds records that do not fit the pattern of the rest of the data. Weirdly enough, this is one of the most commercially valuable techniques — fraud detection alone justifies its existence. Isolation Forest is the standard algorithm for tabular data; it works by isolating anomalies through random splits, and anomalies are isolated faster because they are few and different. One-Class SVM works well on smaller, high-dimensional datasets.
- Anomaly Detection — Methods, Metrics and Use Cases
- Isolation Forest — Implementation and Tuning Guide
- Statistical Methods for Outlier Detection
- Anomaly Detection in Finance — Fraud and Risk Applications
Model Evaluation
The first thing you do before evaluating any model is split your data: training set for learning, test set for measurement. Never evaluate on data the model has already seen. That’s the trap most beginners fall into — measuring training accuracy instead of test accuracy, then being confused when the model fails on new data.
Accuracy is a dangerous default metric. A model that predicts “not fraud” for every transaction is 99.9% accurate on a typical fraud dataset — and completely useless. Class imbalance is common in real data. Use precision, recall and F1 score when your classes are unequal in size.
| Metric | What It Measures | Use When |
| Accuracy | Fraction of correct predictions across all classes | Classes are roughly balanced |
| Precision | Of all positive predictions, how many were actually positive | False positives are costly (spam filters) |
| Recall | Of all actual positives, how many did you catch | False negatives are costly (disease screening) |
| F1 Score | Harmonic mean of precision and recall | Classes are imbalanced |
| AUC-ROC | Model’s ability to rank positives above negatives across all thresholds | Comparing models independent of threshold |
| RMSE | Root mean squared error — average prediction error in original units | Regression problems |
- Train/Test Split and Cross-Validation — The Correct Way to Evaluate
- Confusion Matrix — How to Read and Interpret Every Cell
- Precision vs Recall — The Trade-off Every Practitioner Faces
- F1 Score — When Accuracy Is Not Enough
- AUC-ROC Curve — Threshold-Independent Model Comparison
- Overfitting vs Underfitting — Diagnosing and Fixing Both
- Bias-Variance Trade-off — The Core Tension in Model Building
Data Mining Tools and Software
To be fair to every tool here: the best one is the one your team already knows and your data pipeline already supports. That said, Python is the clear dominant choice for new projects in 2026 — scikit-learn covers nearly every technique in this tutorial, pandas handles data manipulation, and the ecosystem is enormous. R is the better choice for academic statistical work and specialized bioinformatics tasks. Everything else below serves specific use cases well.
| Tool | Best For | Skill Level | Cost |
| Python (scikit-learn, pandas, NumPy) | General-purpose data mining; most job roles require it | Beginner → Advanced | Free |
| R | Statistical analysis, academic research, clinical data | Intermediate | Free |
| SQL | Data extraction; required regardless of analysis language | Beginner | Free |
| Apache Spark MLlib | Mining at scale — datasets too large for a single machine | Advanced | Free (cloud costs vary) |
| KNIME | Visual no-code pipeline building; fast prototyping | Beginner | Free / Paid tiers |
| Weka | Academic coursework; algorithm experimentation | Beginner | Free |
- Python for Data Mining — scikit-learn, pandas and NumPy Setup Guide
- R for Data Mining — When and Why to Choose R
- Apache Spark MLlib — Distributed Data Mining at Scale
- KNIME Tutorial — Visual Data Mining Without Code
- Weka — Getting Started with the Academic Workbench
- SQL for Data Analysis — Queries Every Data Miner Must Know
Common Data Mining Mistakes and How to Avoid Them
Most articles on data leakage describe it as accidentally including the target variable in your features. That framing misses the real danger. Data leakage is any information that would not be available at prediction time leaking into your training data. A hospital readmission model trained on discharge summaries — which are written after the readmission decision has already been made — is leaking. The model hits 90% accuracy in testing and fails completely in production. I’ve watched teams spend three months building a model only to discover this problem the week before launch. The fix is simple: ask yourself “would I have this data point at the exact moment I need to make this prediction?” If the answer is no, remove the feature.
Critical mistake: evaluating on training data
If your model gets 100% accuracy, check whether you accidentally evaluated it on training data. Perfect scores on real test sets are almost always a sign something is wrong — not that your model is extraordinary.
- Data Leakage — The Most Dangerous Mistake in Data Mining
- Overfitting — When Your Model Memorizes Instead of Generalising
- Correlation Is Not Causation — Real Examples and How to Avoid False Insights
- Class Imbalance — How to Detect It and Which Techniques Help
- Dirty Data — Real Consequences and a Cleaning Checklist
- Choosing the Wrong Technique — A Diagnosis Guide
How to Learn Data Mining — Beginner’s Roadmap
Four stages. Work through them in order. The key variable is how fast you move from tutorial datasets (Iris, Titanic) to real data that has not been pre-cleaned for you — that transition compresses learning faster than any course.
Statistics Foundations — 2 to 4 weeks
Mean, median, standard deviation, probability distributions, correlation and hypothesis testing. Without these, you cannot interpret EDA results or understand what your evaluation metrics are actually measuring. Khan Academy Statistics and StatQuest on YouTube are both free and genuinely good.
Python and Data Manipulation — 4 to 6 weeks
pandas for data manipulation, NumPy for numerical operations, Matplotlib and Seaborn for visualization. Do not jump to scikit-learn until you can load a CSV, clean it, explore it and plot distributions without looking anything up. That foundation makes every algorithm section much faster to learn.
Core Techniques with Practice Datasets — 6 to 8 weeks
Work through classification, regression, clustering and association rules on the UCI Machine Learning Repository and Kaggle datasets. Use the Titanic dataset for classification, California Housing for regression, and the Instacart grocery orders dataset for association rule mining. For each technique: implement it, evaluate it, and read the scikit-learn documentation for the algorithm’s parameters.
End-to-End Project on Real Data — ongoing
Pick a domain you know — healthcare, e-commerce, finance, sports — and build a complete pipeline from scratch: collect or download raw data, clean it, run EDA, choose a technique, build and evaluate the model, and present the results as if your audience is a non-technical manager. This single project will teach you more than the previous three stages combined.
- Data Mining Prerequisites — What to Know Before You Start
- Best Free Datasets for Practising Data Mining — UCI and Kaggle Guide
- Your First Data Mining Project — Step-by-Step with Real Data
- Data Mining Career Path and Salary Guide — 2026 Edition
Data Mining Applications and Industry Use Cases
Data mining is active in almost every sector. The examples below are named and specific — not generic descriptions — so you can see exactly how each technique maps to an outcome you likely already know.
- Data Mining in Healthcare — Disease Prediction, Diagnosis and Drug Discovery
- Data Mining in Finance — Credit Scoring, Fraud Detection and Risk Modelling
- Data Mining in Retail — Market Basket Analysis and Customer Segmentation
- Data Mining in Marketing — Churn Prediction and Campaign Targeting
- Data Mining in Manufacturing — Predictive Maintenance and Quality Control
- Data Mining in Education — Student Performance and Early Intervention
- Data Mining in Cybersecurity — Intrusion Detection and Anomaly Monitoring
- Data Mining in Supply Chain — Demand Forecasting and Inventory Optimisation

Data Analyst Course
Average time: 6 months
Skills you’ll build: SQL, Python for Data Analysis, Power BI, Excel with AI, Data Storytelling, Stakeholder Reporting
Frequently Asked Questions
Q1. What is the difference between data mining and machine learning?
Ans. Data mining encompasses all these stages, from problem definition through data collection, preprocessing, exploration, model development and evaluation. Machine learning is one family of techniques that fall into these steps and are used for building prediction models. Data mining can be performed without using machine learning (e.g., rule-based association mining does not need machine learning). But machine learning cannot be done without performing data preparation and evaluation tasks that form the core of data mining.
Q2. Which programming language is best for data mining?
Ans. Python in 2026. This language, its libraries (scikit-learn, pandas, NumPy, Matplotlib), cover every method mentioned in this tutorial. If you have to conduct more advanced statistical modeling or bioinformatics research, then R will be a better choice for that purpose. You will definitely need to learn SQL regardless of whether you pick Python or R for analytics because in most cases you have to get data out of a relational database first.
Q3. Is data mining still relevant in 2026 with large language models everywhere?
Ans. Even more pertinent today. Large Language Models are trained based on data that is so vast that it needs a data mining pipeline for preparation. Validation and analysis of their output use data mining methods. Mining structured patterns out of tabular, transactional and operational data which constitute the bulk of Business Intelligence operations are far from LLMs’ strong points. The two areas complement one another.
Q4. How long does it take to learn data mining?
Ans. It takes about four to six months of daily practice for someone with only basic mathematical knowledge to become competent in the area outlined above. The estimation assumes that after the third month, you’ll be working with messy data sets. Working beyond that point with pre-processed data will bring you lesser benefit as the practical skills matter most here.
Q5. What are the best datasets for practising data mining?
Ans. The relevance of the topic cannot be overstated now. Large Language Models are trained using such an extensive dataset that requires a data mining pipeline for its preparation. Validation and evaluation of their results are done using the data mining techniques. Data mining of structured patterns from tabular, transactional, and operational data, which form the core of Business Intelligence activities, is not among the strengths of LLMs. The two fields complement each other.
Q6. What is the most commonly used data mining technique in production?
Ans. It takes roughly four to six months of intensive practice for a person with basic math skills to master the field discussed above. This estimate presupposes that by the end of the third month, you will be dealing with raw datasets. Further work with pre-processed data is going to yield less benefit because practical skills are what really counts.


